Figure 3.1
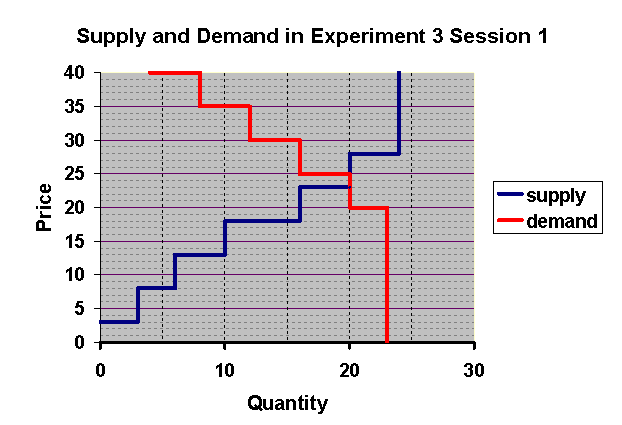
Figure 3.1
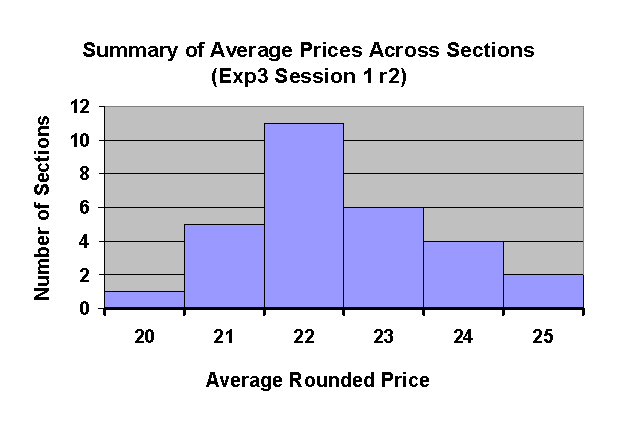
Figures 3.2 and 3.3 show the distribution of mean transaction prices across the classes in the first and second round of Experiment 3. (Many classes reported only the round 2 results and not the round 1 results. Thus we have many more observations for round 2 than for round 1.
Figure 3.2
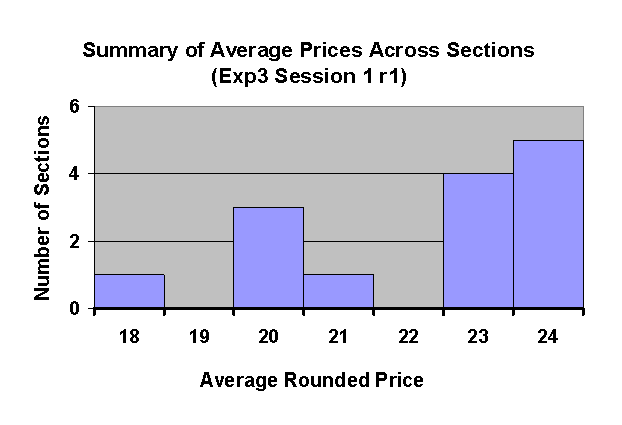
Figure 3.3
The frequency distributions of transactions prices over the entire population of students taking the course is shown in Figure 3.4 for rounds 1 and 2. Prices seem to be converging quite well toward the equilibrium range, with some persistent trading at $20, which is slightly less than the equilibrium price.
Figure 3.4

Figure 3.5
Figures 3.6 and 3.7 show the distribution of class mean prices for rounds 1 and 2 of Session 2.
Figure 3.6
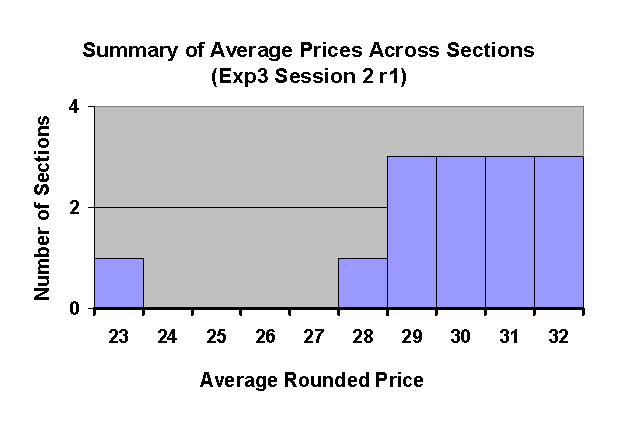
Figure 3.7
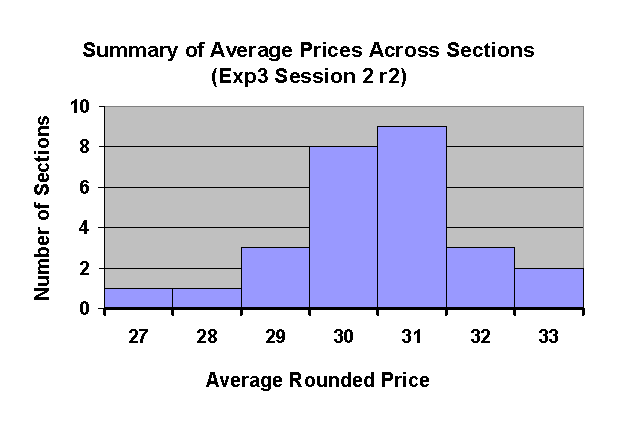
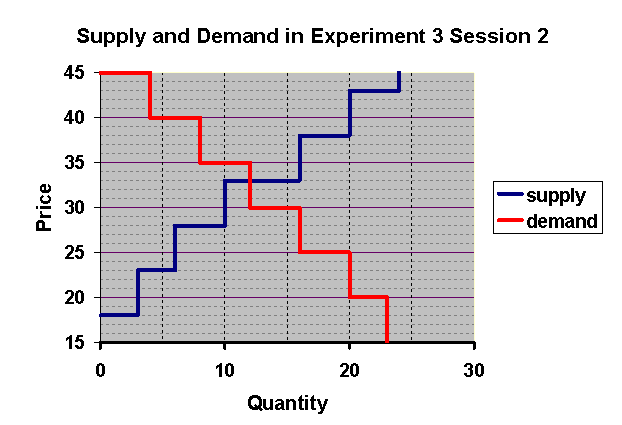
Figure 3.8 shows the distribution of transaction prices in Session 2. The competitive equilibrium price in this session is $33..
Figure 3.8
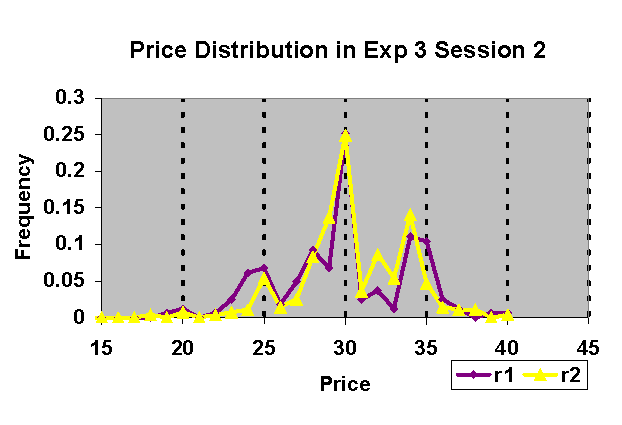
Figure 3.9
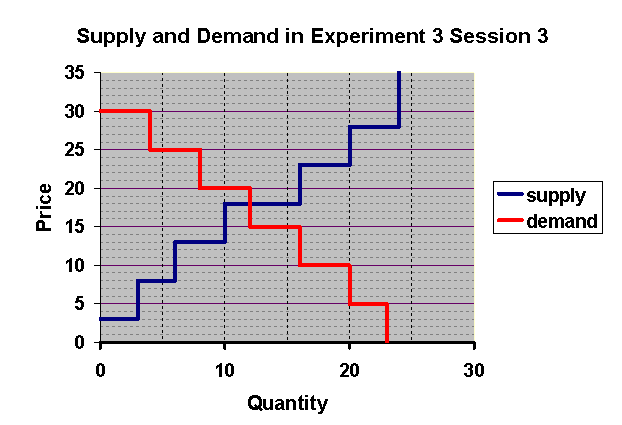
Figures 3.10 and 3.11 show the distribution of mean prices across classrooms in Rounds 1 and 2 of Session 3.
Figure 3.10
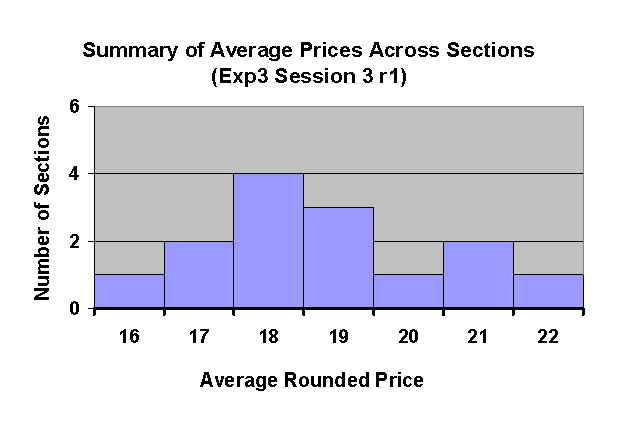
Figure 3.11
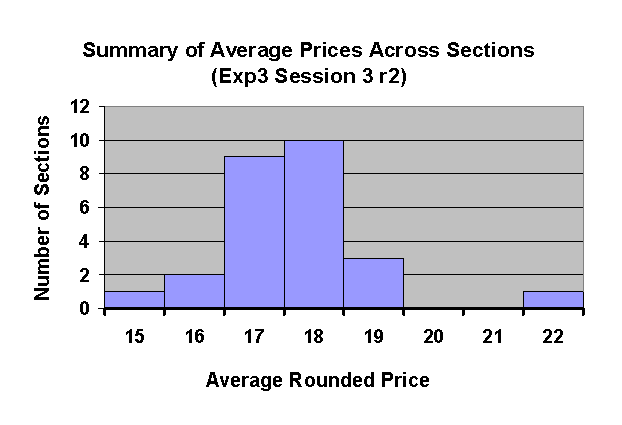
Figure 3.12 shows the frequency distribution of transaction prices in the two rounds of Session 3.
Figure 3.12
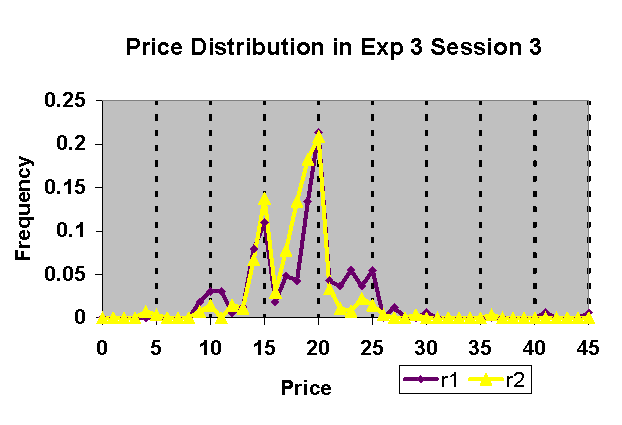
Figure 3.13